this post was submitted on 09 Apr 2024
76 points (98.7% liked)
GenZedong
4487 readers
58 users here now
This is a Dengist community in favor of Bashar al-Assad with no information that can lead to the arrest of Hillary Clinton, our fellow liberal and queen. This community is not ironic. We are Marxists-Leninists.
This community is for posts about Marxism and geopolitics (including shitposts to some extent). Serious posts can be posted here or in /c/GenZhou. Reactionary or ultra-leftist cringe posts belong in /c/shitreactionariessay or /c/shitultrassay respectively.
We have a Matrix homeserver and a Matrix space. See this thread for more information. If you believe the server may be down, check the status on status.elara.ws.
Rules:
- No bigotry, anti-communism, pro-imperialism or ultra-leftism (anti-AES)
- We support indigenous liberation as the primary contradiction in settler colonies like the US, Canada, Australia, New Zealand and Israel
- If you post an archived link (excluding archive.org), include the URL of the original article as well
- Unless it's an obvious shitpost, include relevant sources
- For articles behind paywalls, try to include the text in the post
- Mark all posts containing NSFW images as NSFW (including things like Nazi imagery)
founded 4 years ago
MODERATORS
you are viewing a single comment's thread
view the rest of the comments
view the rest of the comments

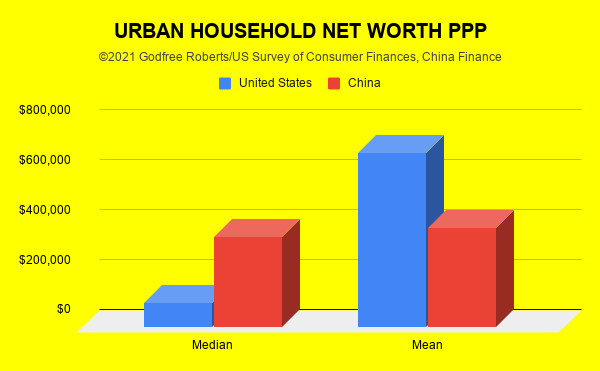
This is a powerful graph, but sadly it requires math literacy.
Only a little.
Just to avoid misunderstanding this graph, could you explain to me what was your conclusion comrade?
This will help me understand the message!
Short version: A few ultra-rich people in the US own a lot of real estate, bringing up the average, whereas in china its more equally spread out.
When the mean is very different from the median, it means the standard deviation is very high (IE, the values are really spread out, rather that clumped close). A simple example would be 2 economies each with 3 people.
Economy A: 1 person owns everything (Lets say $100 bucks), the 2 others own nothing. Average: $33, Median: $0..
Economy B: Each person owns $33. Average: $33, Median: $33.
The gini coefficient refers to the same thing, but measuring inequality within an economy specifically: 0 gini means everyone has the same net worth, 1 gini means 1 person has 100% of the value. In capitalism, the end-result is just like in a game of monopoly: the end result will be 1. In socialism, the end result, acheived via planning an equitable distribution, should be to get as close to zero as possible.
The standard deviation can be very high with the mean and median being the same.
What the difference between the mean and median indicates is a highly skewed (not normal) distribution.
Excellent explanation!
Thank you for your explanation comrade! This helps a lot!
As the other response pointed out, this graph obviously hints at greater wealth disparity in the US vs China, as one of the most common ways in which the mean can be pulled upwards relative to the median is by the presence of a small minority with extreme wealth at the very top. The median while not perfect is a better representative of the situation in which the "average" person finds themselves, as by definition half are above and half are below this value. Imo one of the most important statistics concepts that everyone should learn is the difference between mean and median and what each value can tell us about how a set of values is distributed.