[-] dallen@programming.dev 1 points 1 day ago

Pydantic offers awesome runtime validation (using Rust).

[-] dallen@programming.dev 6 points 5 days ago

GNOME. Love the simplicity!

[-] dallen@programming.dev 1 points 5 days ago

Always ran xfce on my old used thinkpads!

[-] dallen@programming.dev 21 points 3 months ago

This just means that this project is still too early in development for you. The breaking changes happening in this phase are going to pay off in the long run and prevent the project from getting bogged down.

I would give it another shot when they release v2

[-] dallen@programming.dev 18 points 4 months ago

Did you ever find the missing packets?

[-] dallen@programming.dev 10 points 5 months ago

Sorry, you currently need to click to load another area. You can also navigate with the search bar or randomize by clicking the city icon.

I do want to load things automatically but need to figure out how to avoid hogging to much resources for contouring on the users device.

This is the first time sharing this, so a bit of an early release 😅

14
submitted 5 months ago* (last edited 5 months ago) by dallen@programming.dev to c/cool_github_projects@programming.dev

Repo: https://github.com/damienallen/urban-heat

cross-posted from: https://programming.dev/post/14939898

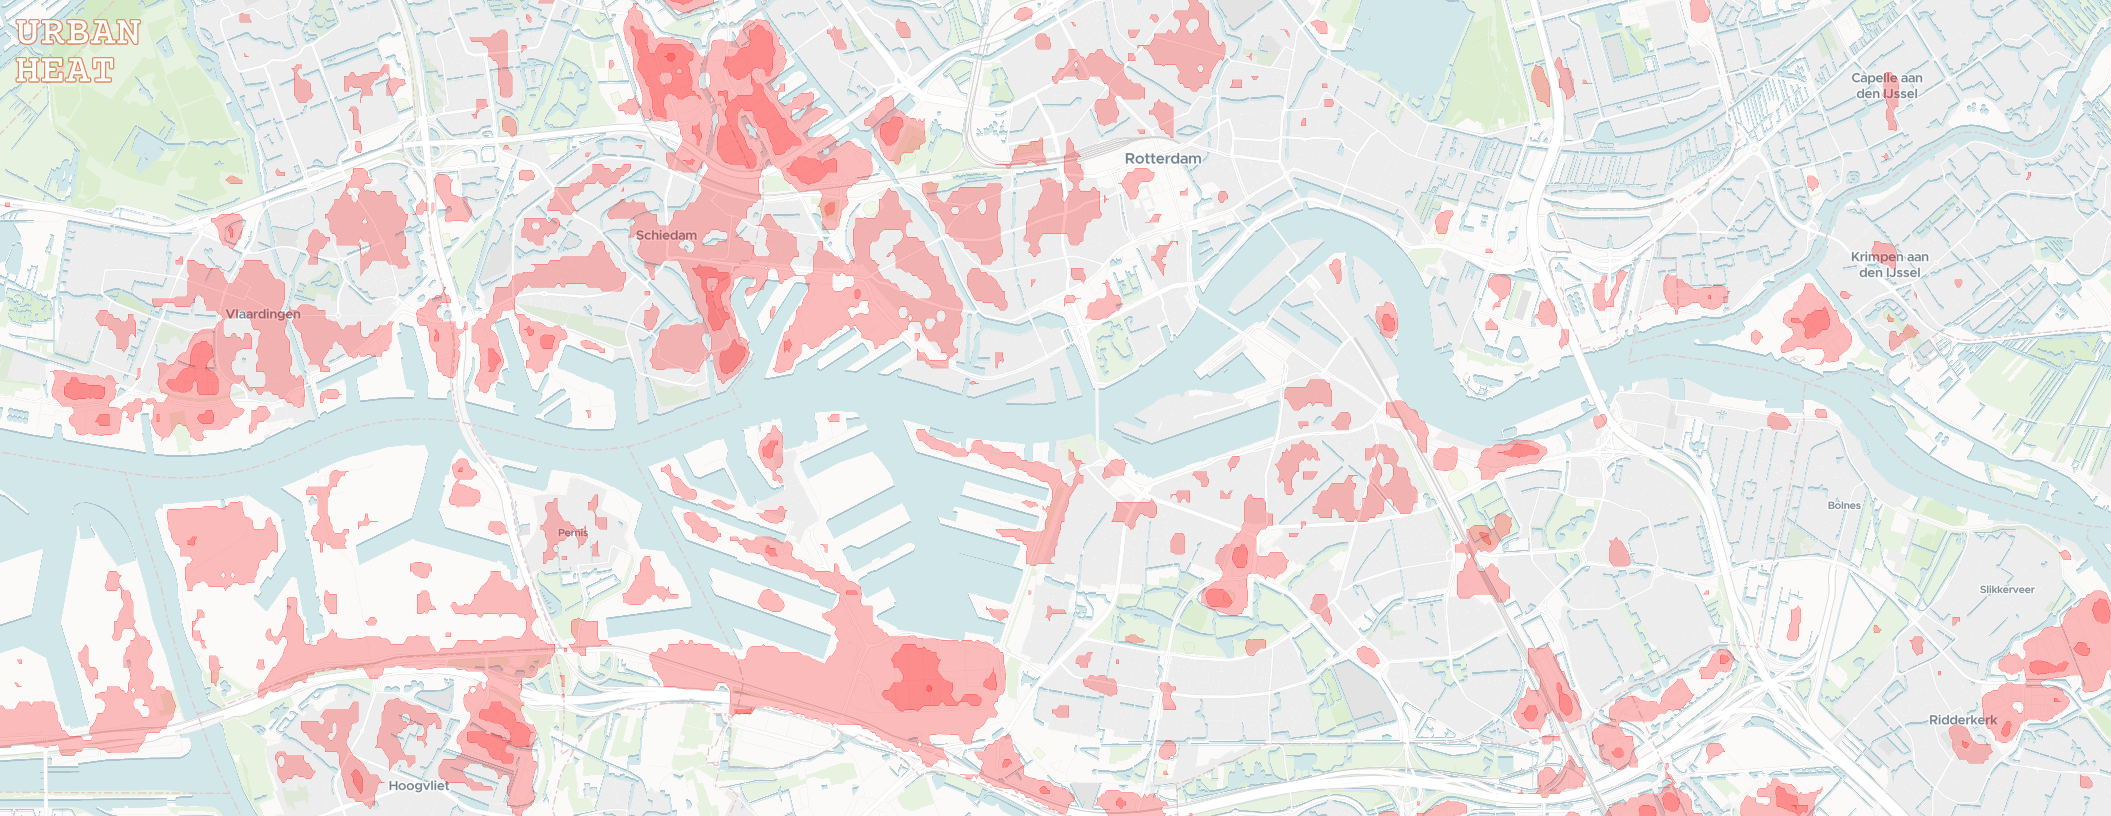
I wanted to share a small project I've been working on. The goal was to make the data from NASA's Landsat Thermal Infrared Sensor more accessible to the general public.

I worked with the raw temperature band data to general annual maximum surface temperature raster images for large urban areas covered by the Eurostat GISCO Urban Audit. In the browser, these images are transformed into easier to interpret isotherm contours with some adjustable settings.

I don't have a specific target audience in mind. The map could help identify areas of refuge for the warmer months, or overheated neighborhoods to avoid as we march towards a toasty future.

Feedback is welcome :)

41
submitted 5 months ago* (last edited 5 months ago) by dallen@programming.dev to c/programming@programming.dev

repo: https://github.com/damienallen/urban-heat

cross-posted from: https://programming.dev/post/14939898

I wanted to share a small project I've been working on. The goal was to make the data from NASA's Landsat Thermal Infrared Sensor more accessible to the general public.

I worked with the raw temperature band data to general annual maximum surface temperature raster images for large urban areas covered by the Eurostat GISCO Urban Audit. In the browser, these images are transformed into easier to interpret isotherm contours with some adjustable settings.

I don't have a specific target audience in mind. The map could help identify areas of refuge for the warmer months, or overheated neighborhoods to avoid as we march towards a toasty future.

Feedback is welcome :)

96
submitted 5 months ago* (last edited 5 months ago) by dallen@programming.dev to c/climate@slrpnk.net

I wanted to share a small project I've been working on. The goal was to make the data from NASA's Landsat Thermal Infrared Sensor more accessible to the general public.

I worked with the raw temperature band data to general annual maximum surface temperature raster images for large urban areas covered by the Eurostat GISCO Urban Audit. In the browser, these images are transformed into easier to interpret isotherm contours with some adjustable settings.

I don't have a specific target audience in mind. The map could help identify areas of refuge for the warmer months, or overheated neighborhoods to avoid as we march towards a toasty future.

Feedback is welcome :)


EDIT: For UK visitors, sorry to leave you with an empty map...

I've taken a look at older urban extent data and found the geometry I need to process the UK (from before leaving Eurostat). However, there are still some UI limitations to overcome since it seems that cities are split into many boroughs that could only be viewed one at a time. The reason I went with the Eurostat dataset to begin with was a nice delineation of what a city was (for the purposes of this project).

Don't have a timeline, but I do want to add the UK and automatic loading of cities as you pan!

[-] dallen@programming.dev 10 points 5 months ago

If the open source release is adequate then you can just continue using it… Or fork for your needs.

[-] dallen@programming.dev 15 points 8 months ago

You can always set watchtower to blindly pull for you. If it’s going to be broken anyways, might as well automate the process.

[-] dallen@programming.dev 16 points 9 months ago

#! brings back some good memories :)

[-] dallen@programming.dev 16 points 1 year ago

I find Mint to be the most obvious choice for beginners who don’t use Lemmy.

[-] dallen@programming.dev 11 points 1 year ago

Would never touch it personally, but I found your history of Windows piracy in China very interesting!

In the US the license was always bundled with the hardware unless you build your own. I worked for my university’s computer labs IT department and was able to acquire a key that I used for about a decade. Later, also scavenged a key from an old broken laptop, back when they printed it on the bottom, for my current Windows partition. Best to avoid paying for it…

I’ve been using mostly Windows for a desktop and Linux for servers for many years, but 11 is where I have to call it quits. My old friend Debian leads me forward from here :)

[-] dallen@programming.dev 16 points 1 year ago* (last edited 1 year ago)

Unpopular choice here but Ubuntu LTS with ubuntu-debullshit (vanilla gnome, replace snap with flatpak).

My main factors:

  • stability of the LTS
  • drivers and HW support
  • tons of resources online
  • already use Ubuntu for servers and Raspian on my Pi

I’ve had my fun distro hopping in the past but I just want a low maintenance system nowadays.
view more: next ›

dallen

joined 1 year ago