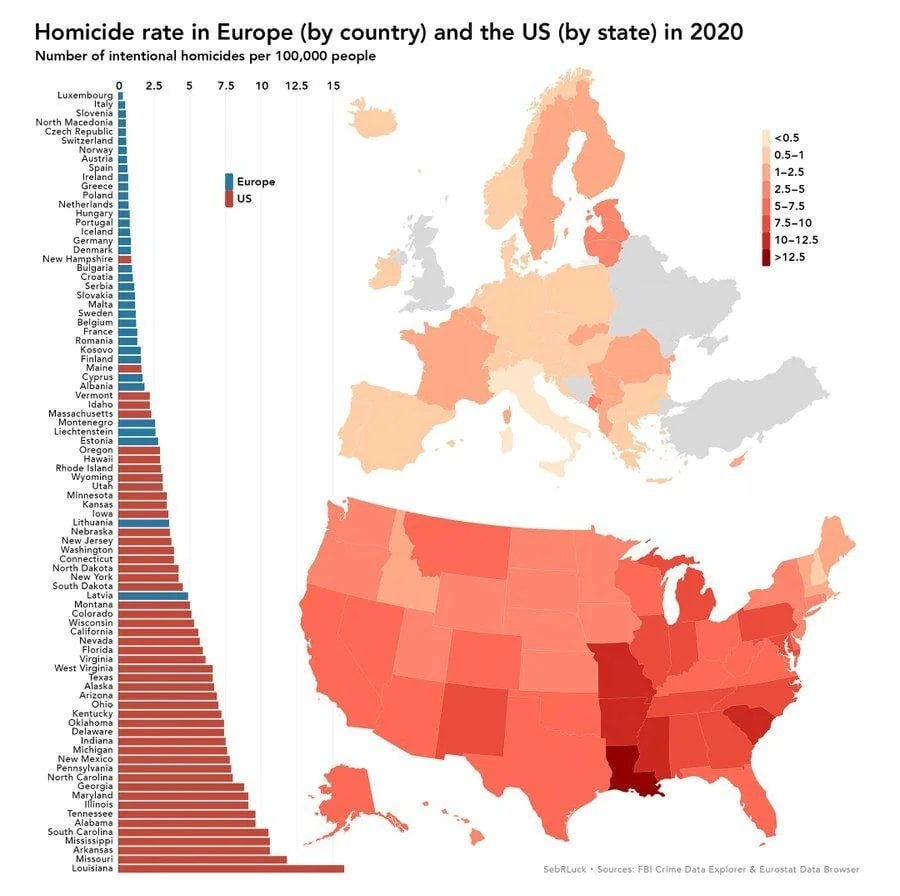
USA is such a great country
Data is Beautiful
A place to share and discuss visual representations of data: Graphs, charts, maps, etc.
DataIsBeautiful is for visualizations that effectively convey information. Aesthetics are an important part of information visualization, but pretty pictures are not the sole aim of this subreddit.
A place to share and discuss visual representations of data: Graphs, charts, maps, etc.
  A post must be (or contain) a qualifying data visualization.

  Directly link to the original source article of the visualization
    Original source article doesn't mean the original source image. Link to the full page of the source article as a link-type submission.
    If you made the visualization yourself, tag it as [OC]

  [OC] posts must state the data source(s) and tool(s) used in the first top-level comment on their submission.

  DO NOT claim "[OC]" for diagrams that are not yours.

  All diagrams must have at least one computer generated element.

  No reposts of popular posts within 1 month.

  Post titles must describe the data plainly without using sensationalized headlines. Clickbait posts will be removed.

  Posts involving American Politics, or contentious topics in American media, are permissible only on Thursdays (ET).

  Posts involving Personal Data are permissible only on Mondays (ET).
Please read through our FAQ if you are new to posting on DataIsBeautiful. Commenting Rules
Don't be intentionally rude, ever.

Comments should be constructive and related to the visual presented. Special attention is given to root-level comments.

Short comments and low effort replies are automatically removed.

Hate Speech and dogwhistling are not tolerated and will result in an immediate ban.

Personal attacks and rabble-rousing will be removed.

Moderators reserve discretion when issuing bans for inappropriate comments. Bans are also subject to you forfeiting all of your comments in this community.
Originally r/DataisBeautiful
i'ld say thats not really a surprise IF you have a system that helps criminals to thrive while it tries hard to always put innocent to jail instead and prevent real investigations for the truth, thats at least how i see it.
Below are some links to related "last week tonight"s from YT.
Plz tell me if thats just a show full of lies or if that terror is real in poor underdeveloped 3rd world US: (i might have linked videos not too bad, but i think i was horrified by the outcomes of those linked)
Prosecutors https://m.youtube.com/watch?v=ET_b78GSBUs
Wrongful convictions https://m.youtube.com/watch?v=kpYYdCzTpps
Migrant crime https://m.youtube.com/watch?v=axsgzg3RyF0
Crime Reporting https://m.youtube.com/watch?v=kCOnGjvYKI0
School police https://m.youtube.com/watch?v=KgwqQGvYt0g
Police interrogations https://m.youtube.com/watch?v=obCNQ0xksZ4
death investogations https://m.youtube.com/watch?v=hnoMsftQPY8
forensic science https://m.youtube.com/watch?v=ScmJvmzDcG0
update: fixed broken link, added titles
There are some surprises among the best us states, or maybe I’m just not as familiar with them as I expected
...But muh second amendment right!
/S
