this post was submitted on 11 Mar 2026
584 points (98.7% liked)
Climate
8420 readers
1010 users here now
Discussion of climate, how it is changing, activism around that, the politics, and the energy systems change we need in order to stabilize things.
As a starting point, the burning of fossil fuels, and to a lesser extent deforestation and release of methane are responsible for the warming in recent decades:

How much each change to the atmosphere has warmed the world:

Recommended actions to cut greenhouse gas emissions in the near future:

Anti-science, inactivism, and unsupported conspiracy theories are not ok here.
founded 2 years ago
MODERATORS
you are viewing a single comment's thread
view the rest of the comments
view the rest of the comments
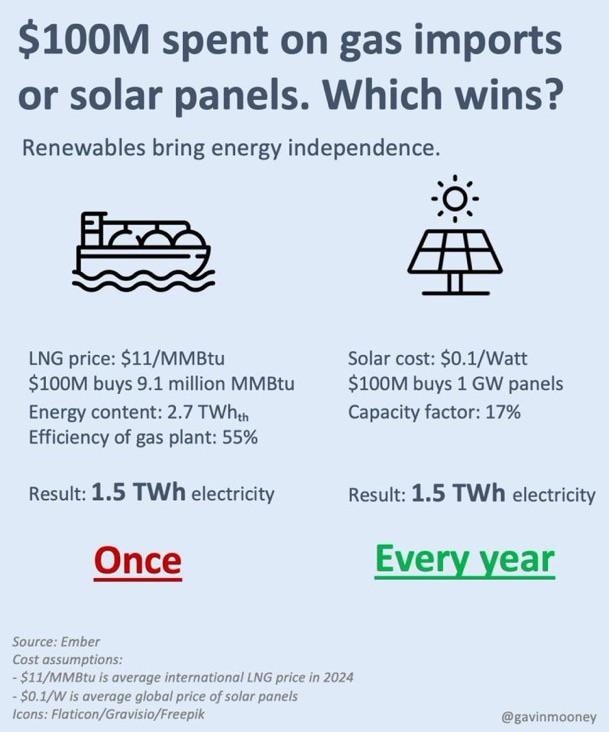
At the present state of things, you're definitely right.
I'm talking about winter, where you can count on solar panels producing... nearly nothing.
This is a company here in Estonia sharing customers' monthly production numbers. This is a company trying to sell you solar installations, so they have no reason to show any numbers as lower than reality. I clicked through several customer experience pages, and most have ~30x less energy generated in December vs May.
The Nebraska comparison in your other reply to me doesn't work out because Nebraska is way further south. In December, the sun doesn't "rise" here as much as it "drags its' rotting carcass across the horizon". Okay, we're not as far north as something like Svalbard, but the angle of the sun during solar noon on December 21 (shortest day of the year in the northern hemisphere) is around 7 degrees. In Nebraska it stays around 25 degrees. While we technically get up to 6 hours of daytime even in December, it's usually overcast so average sunshine per day is about 30 minutes over the winter. And if it's not overcast, you can expect it to get cold fast, driving up usage.
So to go full solar (which I'm discussing as a thought experiment, I don't actually know anyone who wants to go FULL solar), essentially all the energy needs to be generated in about 7-8 months each year, because once the days start getting shorter, they go short REALLY fast. That's going to be a lot of H2 to store.
That's a reasonable suggestion, it's just that we're not burning anything clean like coal here, we're burning shale. It's comparable to lignite (if not worse) in CO2, but way more ash. Yes, shale the actual rock, not shale gas.
It's super frustrating.
Believable for shallow roof angles. Steep angles make a large difference, but it's still definitely a challenge for winter peak demand, and huge summer surpluses.
In Estonia vs Nebraska, 1000 wh/watt/year vs 1800 is a signficant disadvantage, and as you say, December averages 15 minutes/day of solar energy.
I did pick Nebraska for relatively north and sunny location, with ethanol substitute land use. It has 9-10x Estonia's winter production, and so Estonia definitely seems like a shithole solar location.
The H2 system still works for Estonia. I made this for you:
This report outlines the technical and financial feasibility of a self-sustaining
125 kW Solar / 90 kW Electrolysis microgrid in Estonia. Optimized for the high-latitude constraints of the Baltics, this system leverages a summer hydrogen surplus to subsidize a 24/7/365 1 kW baseload datacenter requirement.
1. Core System Configuration
2. Financial & Cost Assumptions
3. Annual Capital & Operating Expense
| Expense Category | Amount (USD) | |
|
| | Total System CapEx | $139,792 | | Annual Debt Service (5%) | $12,383 | | Annual O&M (1%) | $1,397 | | Total Annual Cost (A) | $13,780 |
4. Energy Production & Hydrogen Revenue
Estonia receives ~950 Peak Sun Hours (PSH) annually. The 125 kW array generates ~118,750 kWh/year. After accounting for the 1 kW baseload (8,760 kWh), the remaining ~110,000 kWh is directed to the 90 kW electrolyzer.
5. Winter Reliability Analysis (The "Dark-Month" Stress Test)
Unlike the Nebraska model, the Estonia configuration faces extreme seasonal variance.
Average December Yield: ~30–35 kWh/day (Enough to cover the 24 kWh/day baseload).
Worst-Case "Deep Cloud" Day: ~6–8 kWh/day (
).
The Survival Buffer:
Operational Status: The 90 kW electrolyzer will be completely offline from late October to early March, as all available photons are prioritized for battery health and the 1 kW load.
6. Conclusion: The "Latitude Tax" Equilibrium
This system represents the Saturation Point for Estonia at $2/kg Hydrogen.
Does the wind not blow in Estonia?