this post was submitted on 03 Oct 2024
710 points (98.8% liked)
A Boring Dystopia
13426 readers
540 users here now
Pictures, Videos, Articles showing just how boring it is to live in a dystopic society, or with signs of a dystopic society.
Rules (Subject to Change)
--Be a Decent Human Being
--Posting news articles: include the source name and exact title from article in your post title
--If a picture is just a screenshot of an article, link the article
--If a video's content isn't clear from title, write a short summary so people know what it's about.
--Posts must have something to do with the topic
--Zero tolerance for Racism/Sexism/Ableism/etc.
--No NSFW content
--Abide by the rules of lemmy.world
founded 2 years ago
MODERATORS
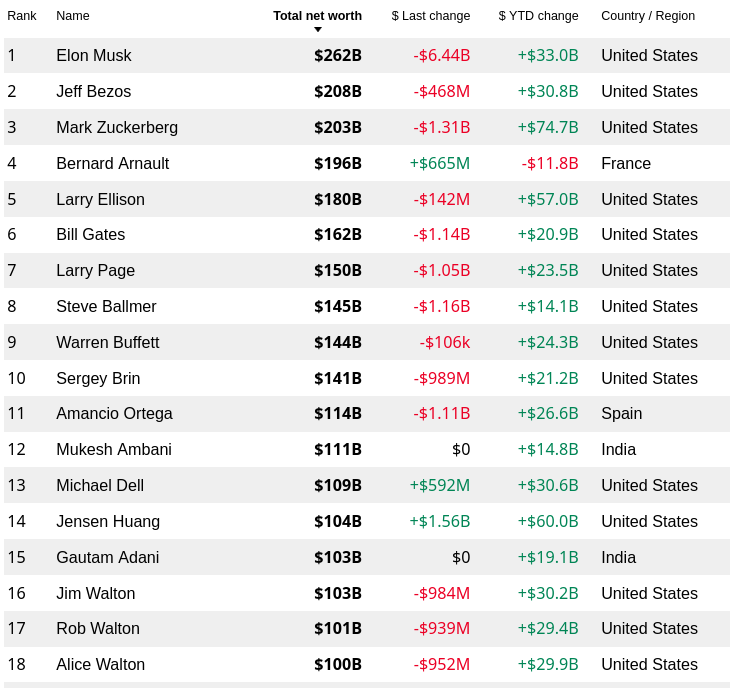
Sorta harsh take, but I do agree that comparing these numbers with additional data would be helpful for establishing a clear understanding of income inequality. It seems this particular table was written for comparing differences in the shown group only.