this post was submitted on 07 Oct 2023
132 points (92.9% liked)
Data Is Beautiful
8906 readers
2 users here now
A place to share and discuss data visualizations. #dataviz
founded 4 years ago
MODERATORS
you are viewing a single comment's thread
view the rest of the comments
view the rest of the comments
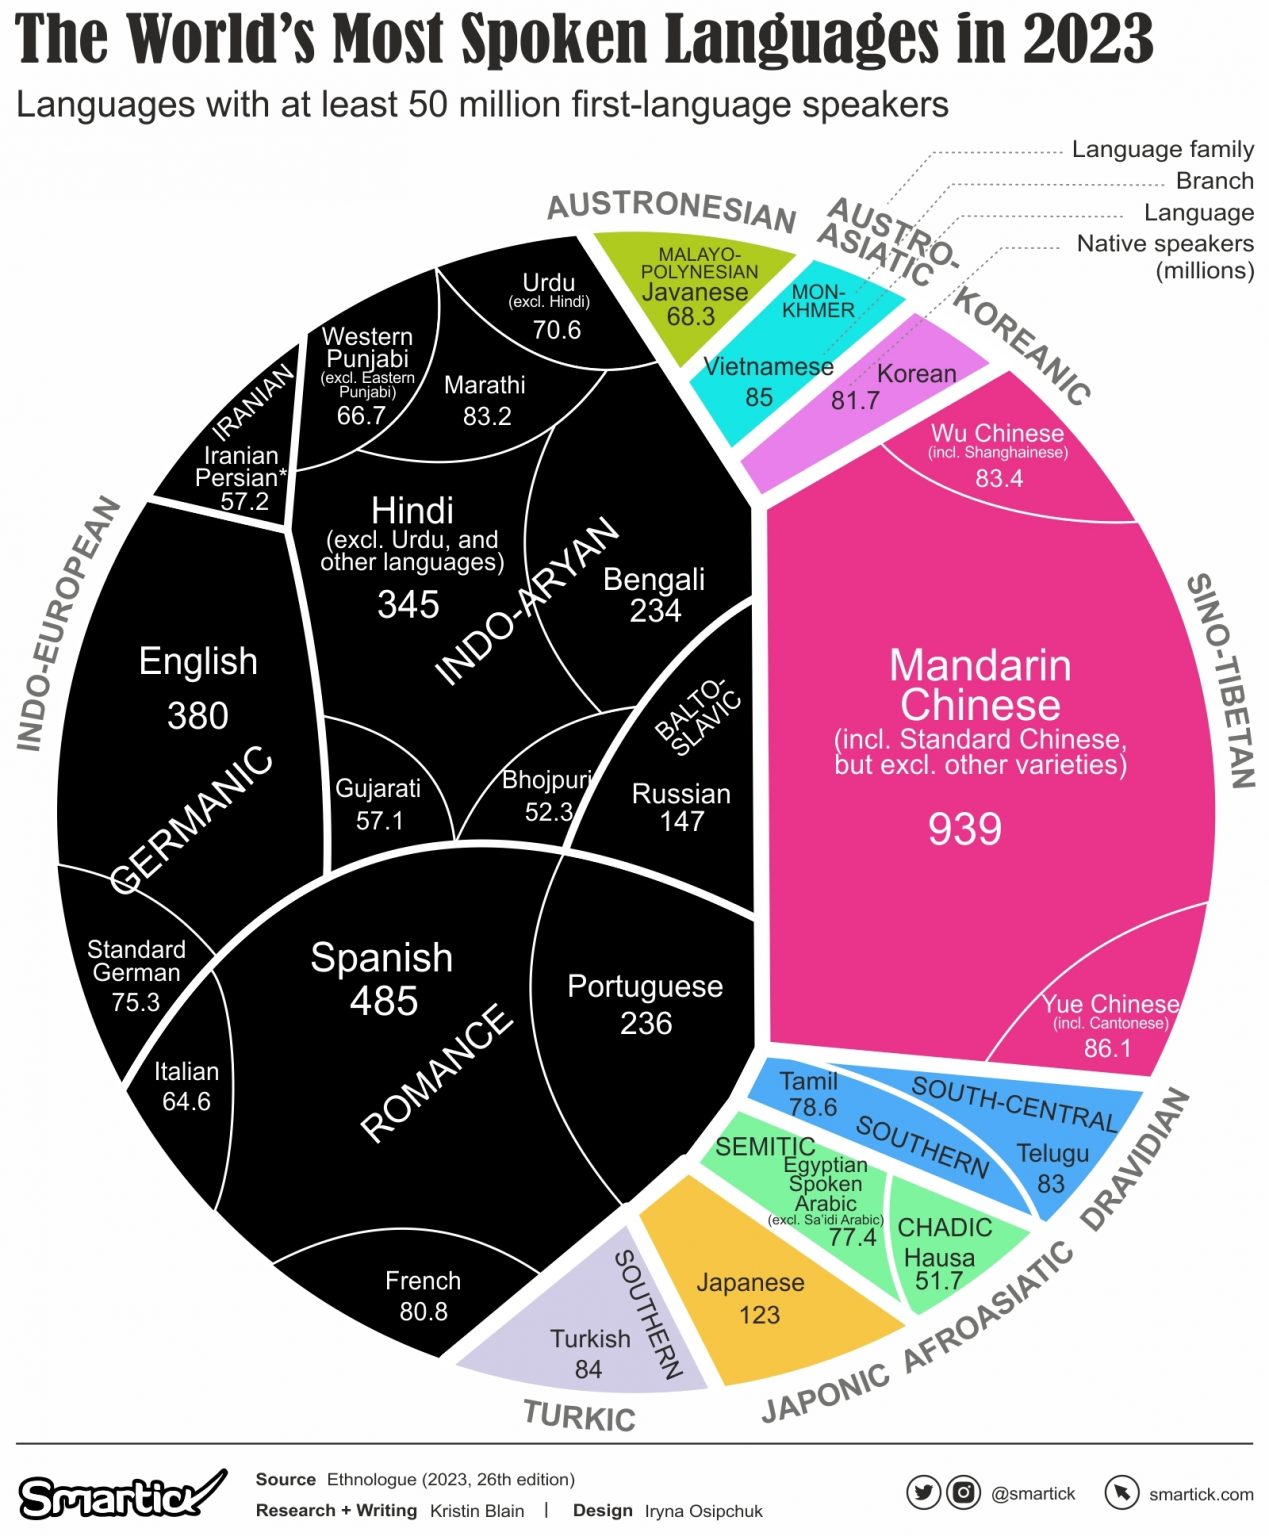
What kind of graph is this? Can I make it with matplotlib?
Looks like a voronoi treemap