People who have never been to L.A. really have no idea how insanely huge it is. Driving to my apartment from the start of city (before you even get to L.A. county) and having the city just keep going and going and going for two hours and not because of traffic jams is something you have to experience to truly understand.
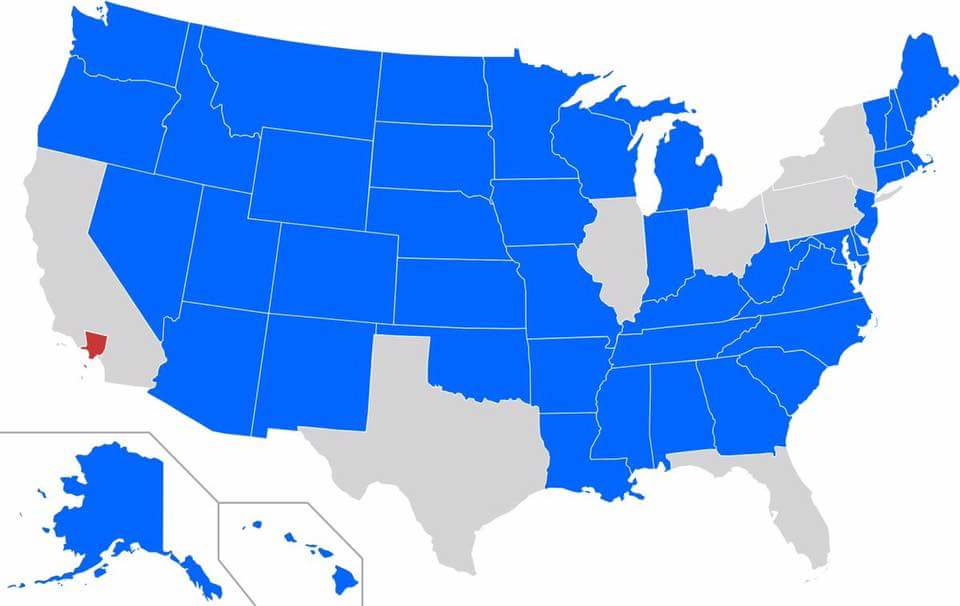
Which population numbers are you using for this graph? Census data for 2020 has LA county at 10.01 million and NC and Georgia at 10.45 and 10.73 million respectively. (for the second link, click on the Table 1 PDF. I didn't want to link to a PDF directly). 2023 numbers seem to have LA county trending down while those states are trending up.
It's still a staggering visual to compare population densities. I just thought the claim was a bit suspect regarding my state.