this post was submitted on 24 Sep 2024
34 points (75.0% liked)
Data is Beautiful
7237 readers
64 users here now
A place to share and discuss visual representations of data: Graphs, charts, maps, etc.
DataIsBeautiful is for visualizations that effectively convey information. Aesthetics are an important part of information visualization, but pretty pictures are not the sole aim of this subreddit.
A place to share and discuss visual representations of data: Graphs, charts, maps, etc.
  A post must be (or contain) a qualifying data visualization.

  Directly link to the original source article of the visualization
    Original source article doesn't mean the original source image. Link to the full page of the source article as a link-type submission.
    If you made the visualization yourself, tag it as [OC]

  [OC] posts must state the data source(s) and tool(s) used in the first top-level comment on their submission.

  DO NOT claim "[OC]" for diagrams that are not yours.

  All diagrams must have at least one computer generated element.

  No reposts of popular posts within 1 month.

  Post titles must describe the data plainly without using sensationalized headlines. Clickbait posts will be removed.

  Posts involving American Politics, or contentious topics in American media, are permissible only on Thursdays (ET).

  Posts involving Personal Data are permissible only on Mondays (ET).
Please read through our FAQ if you are new to posting on DataIsBeautiful. Commenting Rules
Don't be intentionally rude, ever.

Comments should be constructive and related to the visual presented. Special attention is given to root-level comments.

Short comments and low effort replies are automatically removed.

Hate Speech and dogwhistling are not tolerated and will result in an immediate ban.

Personal attacks and rabble-rousing will be removed.

Moderators reserve discretion when issuing bans for inappropriate comments. Bans are also subject to you forfeiting all of your comments in this community.
Originally r/DataisBeautiful
founded 2 years ago
MODERATORS
you are viewing a single comment's thread
view the rest of the comments
view the rest of the comments

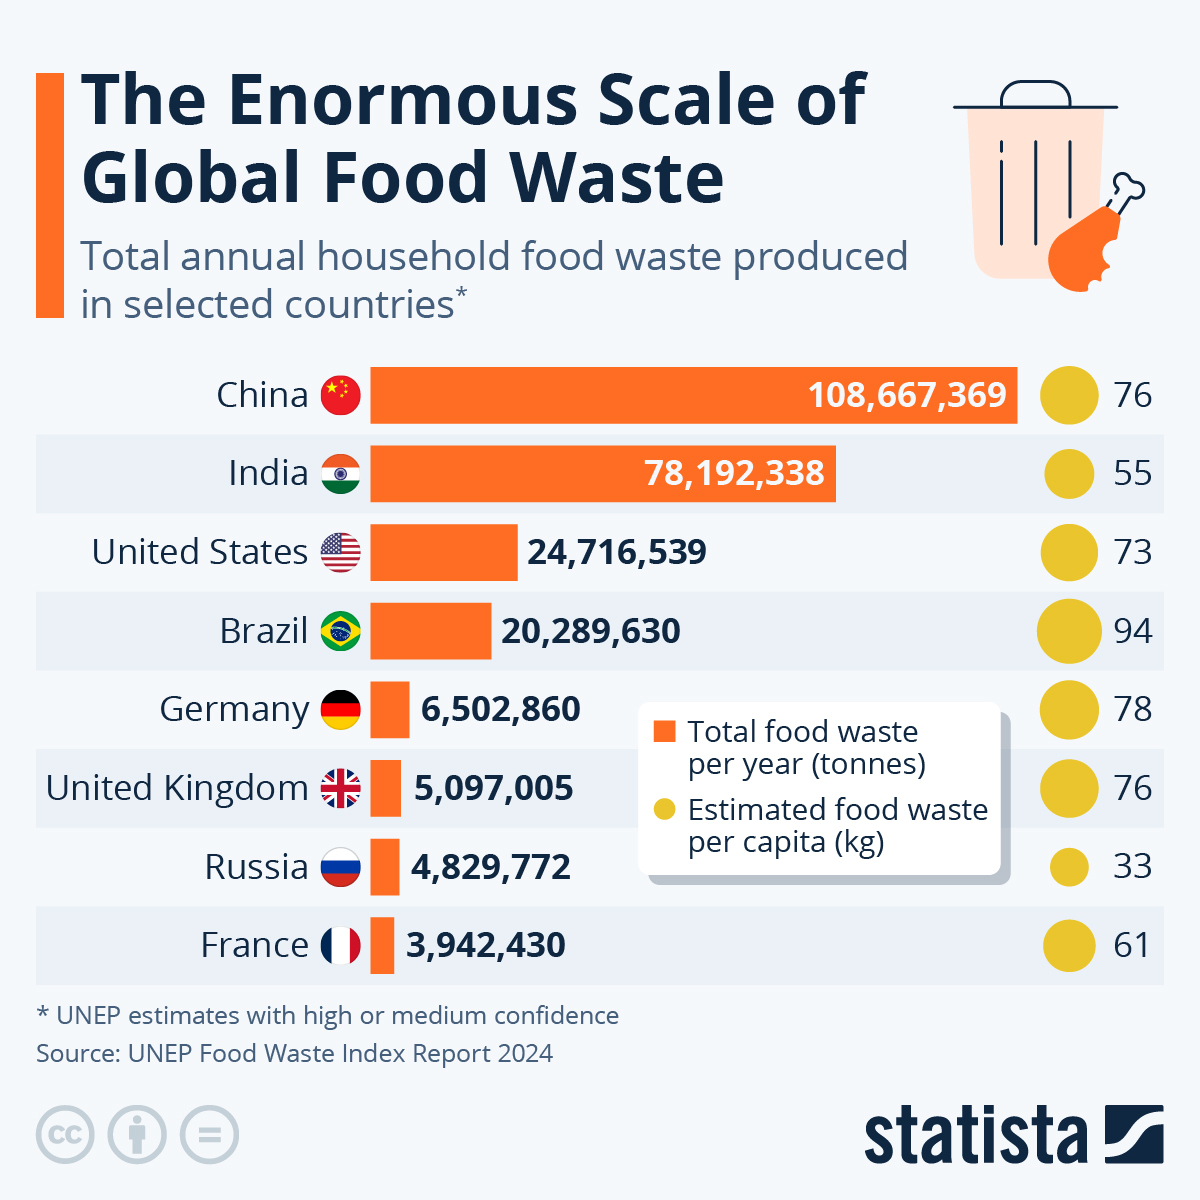
Per capita is the only relevant stat here and its all over the place.
Yeah this almost seems like one of those intentionally misleading at first glance kind of graphs. Once you put a second thought into it why would it be surprising that some of the most populated countries produce more waste?
Richer countries wasting more food, because it’s cheap and abundant makes sense. Brazil has the highest food waste though.
Might this also be connected with availability of food and climate? If food grows all year round and goes bad faster because of a warm and humid climate, it could explain it.
Food waste can happen at many different stages. It might not be economically viable to collect the harvest, if prices are too low. There might not be sufficient transport, storage, and processing available to actually use the food before it goes bad. All of that happens before food even reaches the shop or market.
Growing your own food plays a role in Russia. Many people have their little gardens where they grow stuff for their own use. The amount of waste is possibly much lower from that.
You're probably right, but there are other reasons. I don't have any statistics to support my point, but looking at a (comparatively) low level of food waste in Russia, I could come up with some ideas why (based on 37 years living there):
I'm impressed that the amount per capita in France is significantly less than in Germany or UK, 61 kg vs. 78 kg (76 kg).
Might be related to the culture of cooking and meal preparation.
Yes I'm thinking areas where it's more common to just walk to the local store and buy groceries every couple of days have less food waste than ones where you do bigger trips less often
Also how much do you cook at once. In France it’s common to cook more smaller meals. The care about taste and sophistication is also highly developed in France. It would be interesting to see the numbers for Italy.