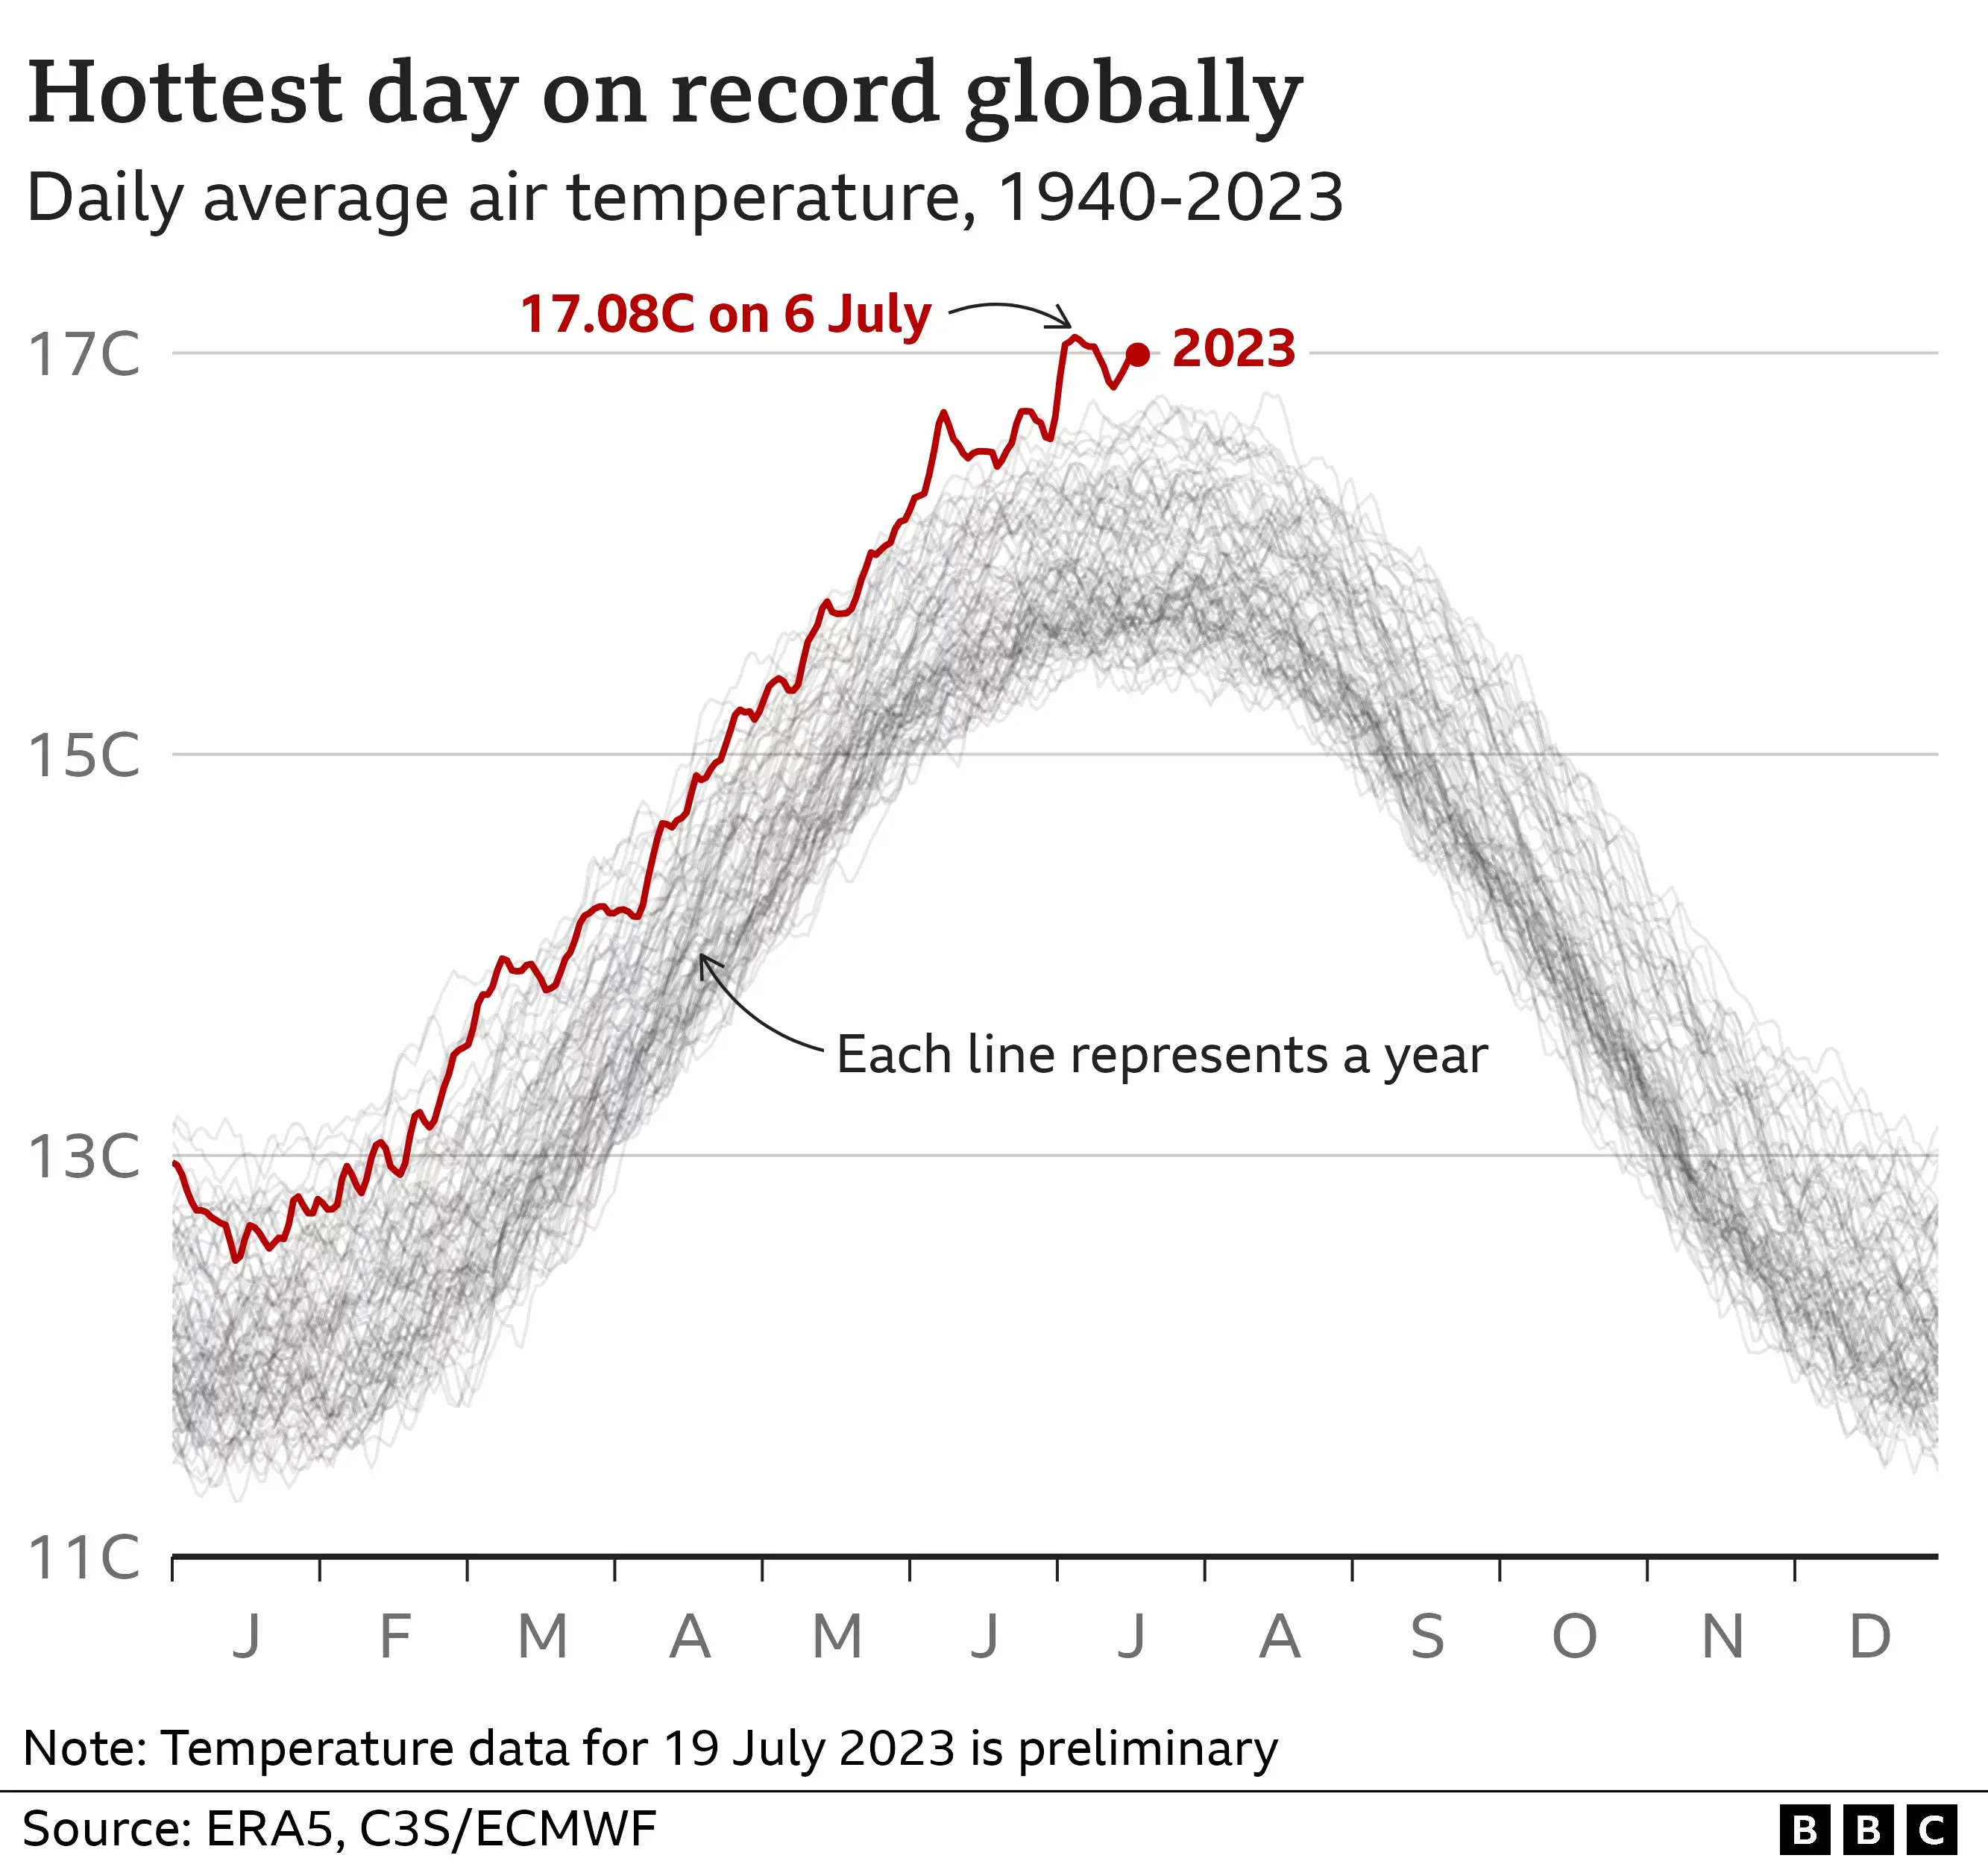
Air temperature graph starts from 1940, that’s 83 years. Enough to gauge trends, since industrialization and copious CO2 emissions in particular are a pretty new thing.
But here’s some data starting from the year 0, in case you’re interested.
ah, some actual data, thanks! still, it looks like an average variance of 1 degree celsius over 2000+ years.
let's be honest though - nothing is going to change in the next ~50 years or so, not enough to stop the slight raise in temperature. no one is willing to go back to living like medieval peasants prior to the industrial revolution. no one politician is going to enact any laws that will return society to that state. no coalition or governmental body is going to do it either. not in America, not in China, not in India, not in Europe.
we would need most of northern africa and all of central australia covered by solar panels, wind turbines everywhere, and probably actual fusion reactors generating power in order to markably decrease global temperatures.
Let's be honest though, actually solving this problem is pretty much unachievable given the lack of motivation and interest on the part of the populace, so why bother taking any action to mitigate the problem at all?
I'm really only interested in punchy 3 word concepts like "stop abortion now" or "fix gay people".
The whole idea of investing some effort now so that the world is better off to some unknown extent later is pretty much Socialism. We won the cold war.
The wealthiest 10% owns 90% of all stocks. And realistically, how many people can actually track the supply chain of every product they buy to try to only buy from ethical companies? How many truly plastic free options even are there for basic things like bread, toothbrushes/toothpaste, or soap?

Air temperature graph starts from 1940, that’s 83 years. Enough to gauge trends, since industrialization and copious CO2 emissions in particular are a pretty new thing.
But here’s some data starting from the year 0, in case you’re interested.
ah, some actual data, thanks! still, it looks like an average variance of 1 degree celsius over 2000+ years.
let's be honest though - nothing is going to change in the next ~50 years or so, not enough to stop the slight raise in temperature. no one is willing to go back to living like medieval peasants prior to the industrial revolution. no one politician is going to enact any laws that will return society to that state. no coalition or governmental body is going to do it either. not in America, not in China, not in India, not in Europe.
we would need most of northern africa and all of central australia covered by solar panels, wind turbines everywhere, and probably actual fusion reactors generating power in order to markably decrease global temperatures.
Let's be honest though, actually solving this problem is pretty much unachievable given the lack of motivation and interest on the part of the populace, so why bother taking any action to mitigate the problem at all?
I'm really only interested in punchy 3 word concepts like "stop abortion now" or "fix gay people".
The whole idea of investing some effort now so that the world is better off to some unknown extent later is pretty much Socialism. We won the cold war.
The populace isn't who creates most of the greenhouse gasses. Try again.
Of course it is.
The populace owns shares in, and buys products from, companies which are producing greenhouse gasses.
The populace elects representatives to regulate those companies.
The wealthiest 10% owns 90% of all stocks. And realistically, how many people can actually track the supply chain of every product they buy to try to only buy from ethical companies? How many truly plastic free options even are there for basic things like bread, toothbrushes/toothpaste, or soap?
You don't need to track the entire supply chain of every product.
Then how are you supposed to know which companies produce how much greenhouse gasses?