this post was submitted on 29 Oct 2025
281 points (97.6% liked)
Just Post
1525 readers
4 users here now
Just post something 💛
Lemmy's general purpose discussion community with no specific topic.
Sitewide lemmy.world rules apply here.
Additionally, this is a no AI content community. We are here for human interaction, not AI slop! Posts or comments flagged as AI generated will be removed.
founded 2 years ago
MODERATORS
you are viewing a single comment's thread
view the rest of the comments
view the rest of the comments
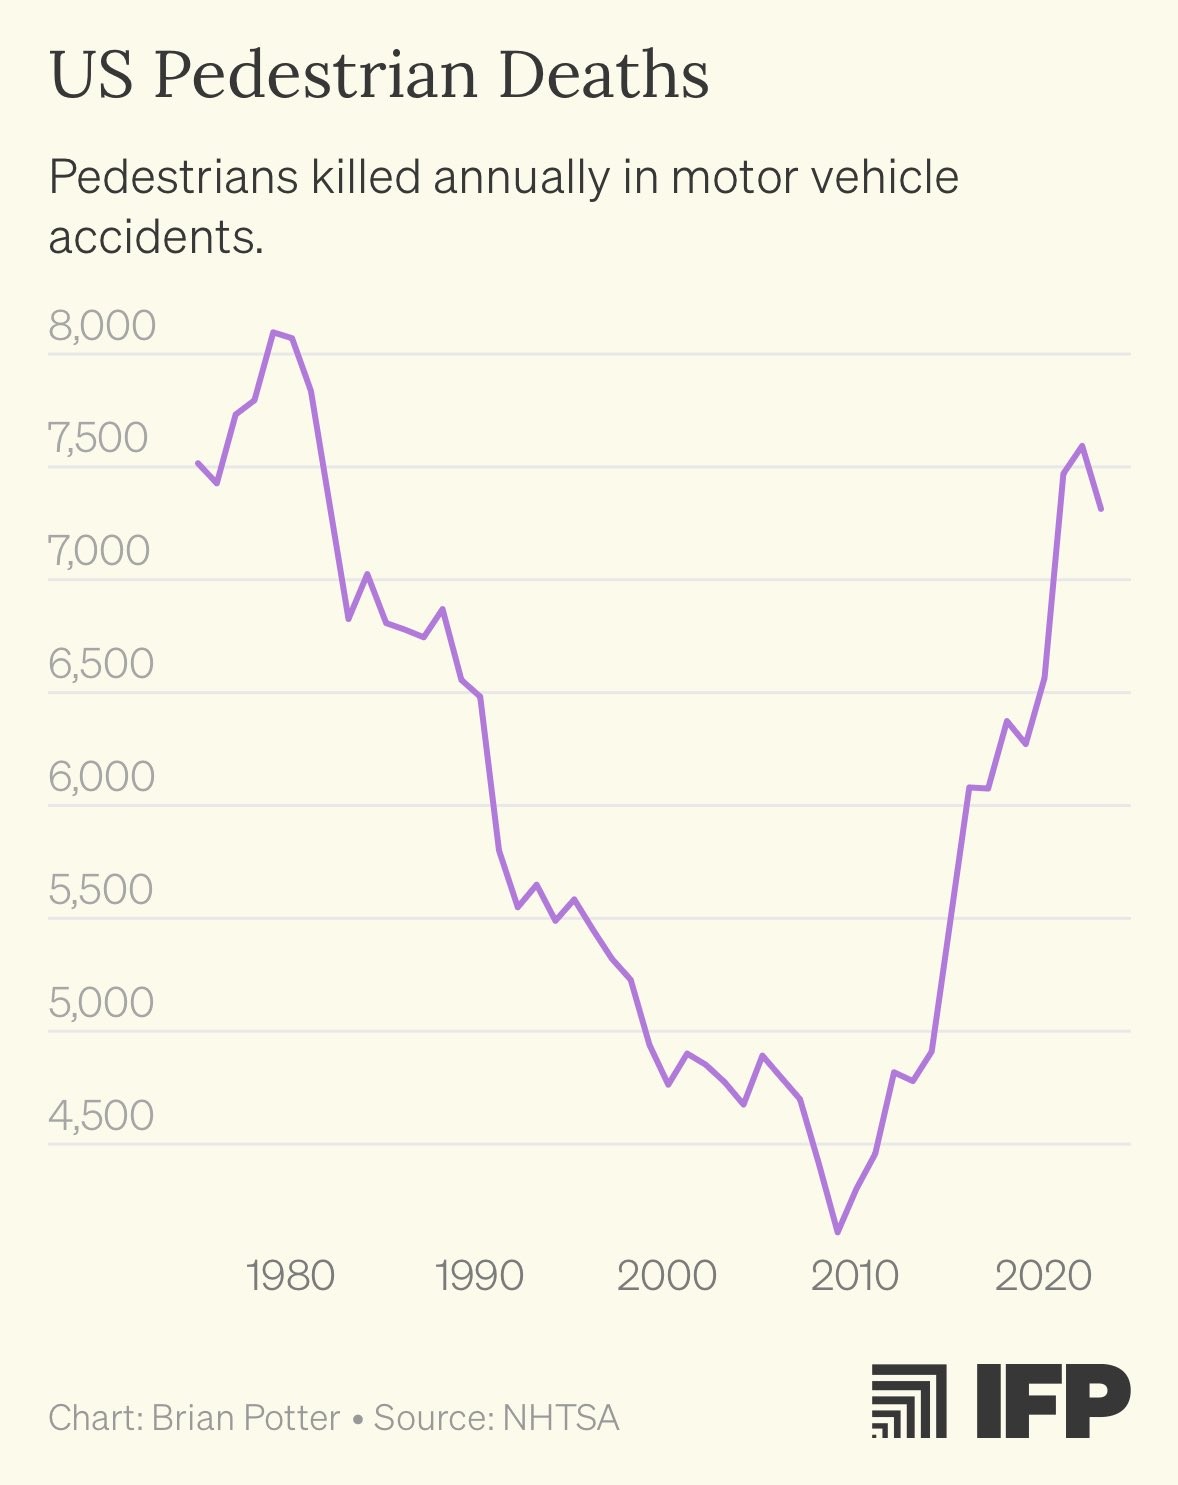
Why? The curves only correlate after 2010.
General increase in car ownership might explain both, more deaths and increased truck sales.