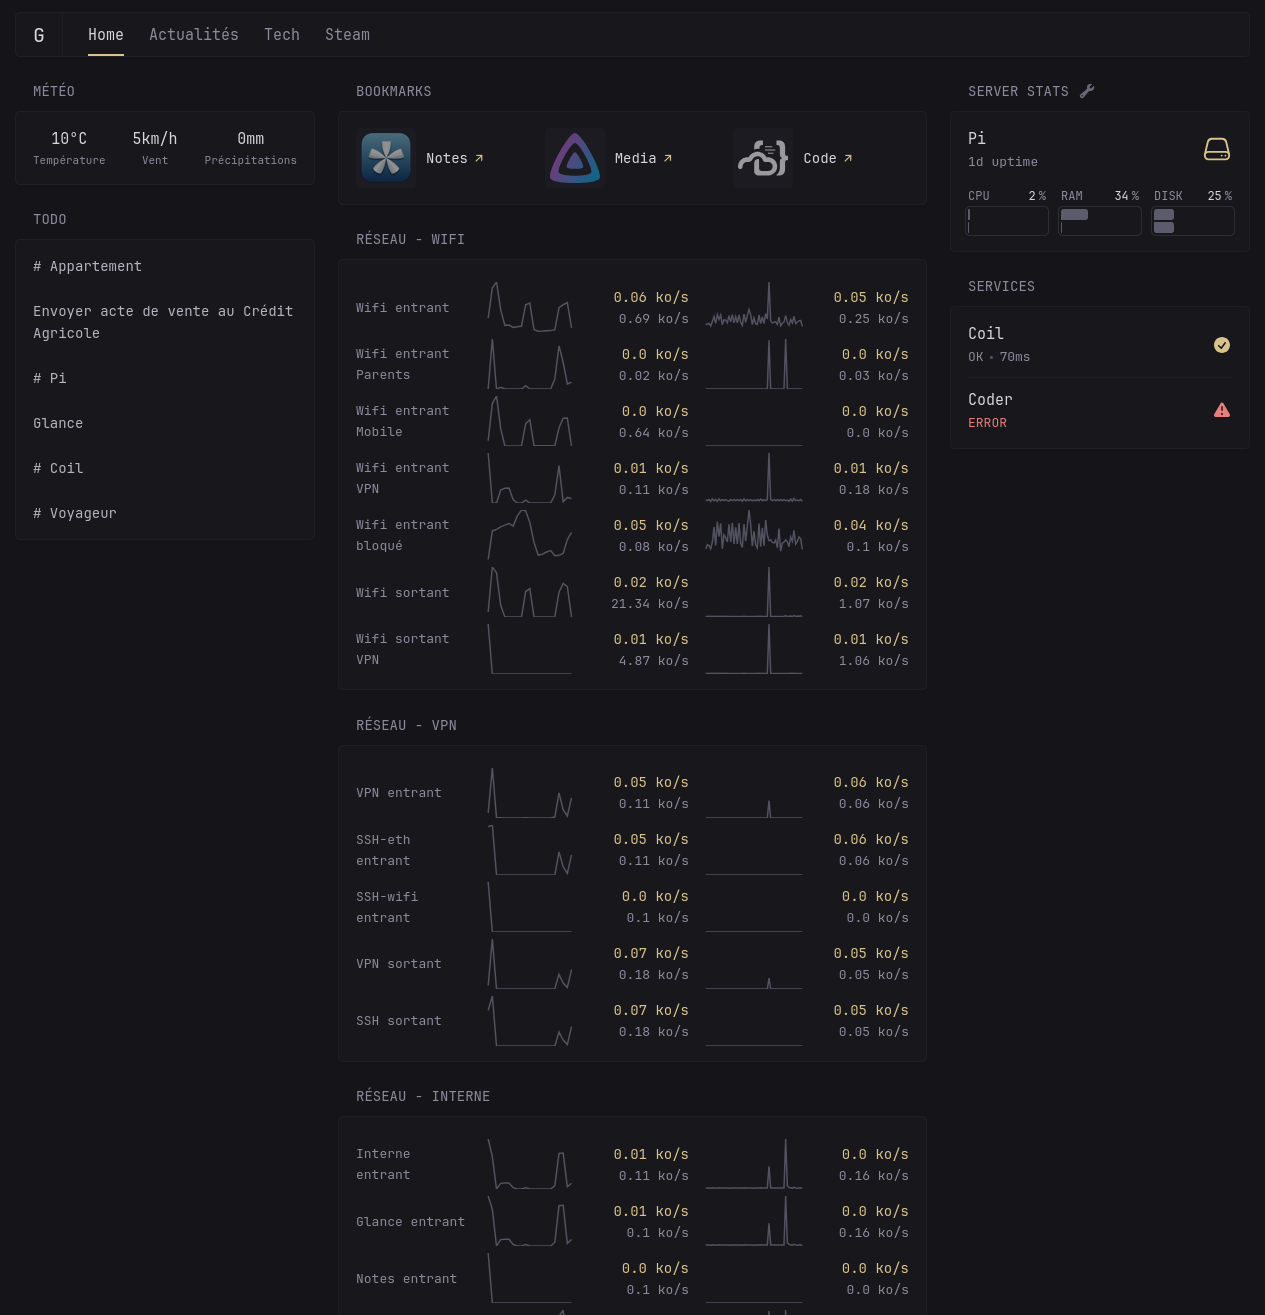
I spent some time learning and configuring my firewall, then displayed it in form of SVG graph on Glance. I'm pretty happy about the result so I wanted to share it :)
A place to share alternatives to popular online services that can be self-hosted without giving up privacy or locking you into a service you don't control.
Rules:
Be civil.
No spam.
Posts are to be related to self-hosting.
Don't duplicate the full text of your blog or readme if you're providing a link.
Submission headline should match the article title.
No trolling.
Promotion posts require active participation, with an account that is at least 30 days old. F/LOSS without a paywall has exceptions, with requirements. See the rules link for details. Tags [CBH] or [AIP] are required, see the links in Rule 8 for details.
AI-related discussions and AI-involved promotional posts have additional requirements for tagging, as noted in Rule 7 and the AI & Promotional Post Expanded Rules post, and find example disclosures here.
Resources:
Any issues on the community? Report it using the report flag.
Questions? DM the mods!
I spent some time learning and configuring my firewall, then displayed it in form of SVG graph on Glance. I'm pretty happy about the result so I wanted to share it :)
Yes the full recipe is: