LabPlot Data Analysis and Visualization Software

119 readers
6 users here now

KDE's data visualization and analysis software. LabPlot is free, open source, works on Linux, WIndows and macOS, and is accessible to everyone.

Share here your tips, tricks and resources, request help, talk to the maintainers and devs, read LabPlot news, connect with other users.

founded 2 years ago
MODERATORS
1


We recommend everybody update to this patch release which is available from our download page:

https://labplot.org/download/

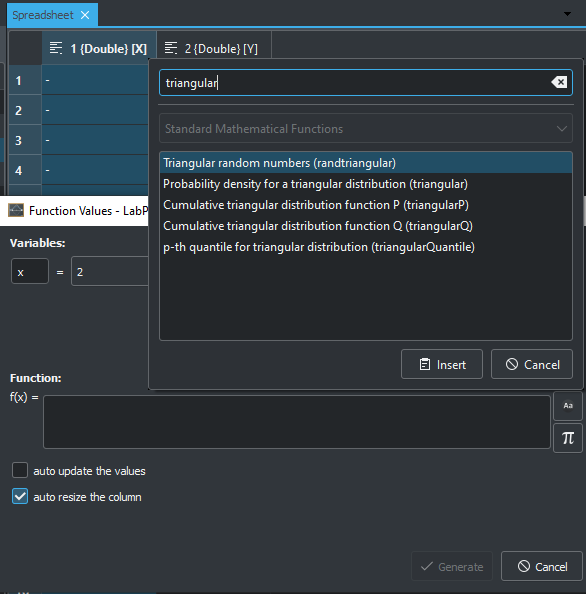
New features and enhancements are coming in the next major release. Stay tuned!

#FLOSS #FOSS #OpenSource #DataAnalysis #DataViz #Science #Statistics #Research #NLNet

2


Dear LabPlot colleagues, May I kindly ask if it is possible to generate a graph similar to the visualisation on the screenshot? For one variable (penicillin), I've been trying to visualise the results of measurements from different laboratories. Thank you already in advance. Best, Michael

P.S.: Would be nice to have the designation of laboratories (A-K) included in the graph (either in the symbols as in my visualisation, or alternatively next to them), but this is optional.

P.P.S.: The scientific context is antimicrobial susceptibility testing, i.e. if a bacterium is susceptible and can thus be treated by the antibiotic (indicated by a big zone diameter, measured in millimeters [mm]) or resistant (small zone diameter).

3


Update: Fixed in 2.11.1-4

Was a packaging issue. Solved within one hour after creating a bugreport. Many thanks to the incredible team!

I run Arch (btw) with KDE plasma using the wayland session.

Today I ran into labplot2: error while loading shared libraries: liborcus-0.18.so.0: cannot open shared object file: No such file or directory

I got the same error for libixion-0.18.

For both libraries I had version 20 something installed.

Is this currently broken? Did anyone else run into the same problem? Libreoffice which also uses liborcus has no problems so I assume it was a Labplot issue. Will file a bugreport as soon as I have a KDE account :D

Workaround: I got it to work by creating symlinks form version 18 -> 20

4


Hello!

I've been using LabPlot for a year aproximately and now I need to prepare some plots for a paper. However, I cannot find information on how to put just only one 0 in the axis intersection when both axis begin in 0. ¿Is there a way to erase one of them or to configure the plot so only one origin is shown?

Thank you

5


Have you seen this video tutorial on how to extract plots, curves and data points from images using #LabPlot's Data Picker tool ?

@labplot@lemmy.kde.social

Data Picker has been available in LabPlot since the version 2.2, but we renamed it recently to Data Extractor.

https://www.youtube.com/watch?v=D%5C_Pz5aA-4Xg

#LabPlot #DataVisualization #PlotDigitizer #DataExtraction #DataExtractor #Plots #Graphs #FreeSoftware #OpenSource #FOSS #FLOSS

6
1
submitted 2 years ago* (last edited 2 years ago) by Stitch0815@feddit.org to c/labplot@lemmy.kde.social


Hi all,

I just started using labplot. Mainly for visualization so far. I am currently plotting stuff in a line plot. For some reason I cannot figure out how to properly align my x-axis. If I reduce the data range my gridlines overextend. If I increase the x-axis range the axis just extends over my data.

Anyone know how to make this fit.

Sorry for the basic question but I have been banging my head against this for 2 days now and just can't figure it out.

If you have some good material beside the videos and documentation I am also happy to just take a link.

Thanks :)

edit: I use LabPlot 2.10.0 on Windows

7


#LabPlot is currently fully available in British English, Catalan, Dutch, Galician, German, Polish, Slovenian, Spanish, Swedish and partially available in French, Italian, Ukrainian, Russian and other languages.

@labplot@lemmy.kde.social

We would like to thank all LabPlot's translators and encourage others to provide translations in other languages ❤️ 🙂

Check translation statistics:
▶️ https://l10n.kde.org/stats/gui/stable-kf5/package/labplot/

Please get involved!
▶️ https://community.kde.org/Get/_Involved/translation

#Translation #OpenSource #FreeSoftware #FOSS #KDE

8


This page contains a list of external resources mentioning #LabPlot and its usage in various areas 👨‍🔬 🔭 🔬 .

➡️ https://labplot.kde.org/references/

@labplot@lemmy.kde.social

If you are aware of other resources that could be listed there, please contact us.

#LabPlot #Science #Research #Students #Physics #Medicine #Chemistry #Biology #Engineering #Ecology #Electronics #Robotics #Education #OpenSource #FreeSoftware

9


If you want to learn #statistics, we highly recommend this YouTube channel: #TileStats.

@labplot@lemmy.kde.social

You can start with this Basic Statistics course:
➡️ https://www.youtube.com/watch?v=YZGG5PpbJdc&list=PLLTSM0eKjC2eSEO7y7MZWb1sdDJiAejoI

#Students #DataAnalysis #DataScience #AI #MachineLearning #Teaching

10
11
12
 
 
13
 
 
14
15


▶️ LabPlot - A free OriginPro alternative for Researchers (Distribution Plots)

@labplot@lemmy.kde.social

Catalyst Nanomaterials Lab has published another video tutorial that shows how to create stunning distribution plots in #LabPlot. Go check it out!

➡️ https://www.youtube.com/watch?v=grnKnbPIgz8

#FreeSoftware #DataAnalysis #DataViz #Research #OriginProAlternative #Science #Tutorial #FLOSS #FOSS #OpenSource #Business #Histogram #ProbabilityDistribution #AlternativeTo #KDE #Students #Researchers #Professionals #SciDavis

16


▶️ LabPlot - A free OriginPro alternative for #Researchers (Scatter Plots)

@labplot@lemmy.kde.social

Catalyst Nanomaterials Lab has published another video tutorial that shows how to create stunning scatter plots, analyze correlations, and uncover hidden patterns in your data using #LabPlot. Go check it out!

➡️ https://www.youtube.com/watch?v=r1Fv1lAEf2c

#FreeSoftware #DataAnalysis #DataViz #Research #OriginProAlternative #Science #Tutorial #FLOSS #FOSS #OpenSource #Business #ScatterPlot #Correlation #SciDavis #Students

17


▶️ LabPlot - A free OriginPro alternative for Researchers (Histogram Plotting)

@labplot@lemmy.kde.social

Catalyst Nanomaterials Lab has published another video tutorial that reveals the secrets of creating stunning histograms in #LabPlot. Go check it out!

➡️ https://www.youtube.com/watch?v=5TGon5QZYic

#FreeSoftware #DataAnalysis #DataViz #Research #OriginProAlternative #Science #Tutorial #FLOSS #FOSS #OpenSource #Business #Histogram #ProbabilityDistribution #AlternativeTo #KDE

18


The graying open source community needs fresh blood :opensource: 💉 🩸

@labplot@lemmy.kde.social
@kde

https://www.theregister.com/2024/07/15/opinion/_open/_source/_attract/_devs/

We agree with the main thesis of the article. And that's one of the reasons why the #LabPlot team strongly supports the idea of mentorship of students and actively participates in such programs as the Season of KDE (SoK) or Google Summer of Code.

#OpenSource #FOSS #FLOSS #FreeSoftware #Mentorship #KDESoK #GSoC #Development #SoftwareDevelopment #Coding #Leadership #Community #KDE

19
1
submitted 2 years ago* (last edited 2 years ago) by LabPlot@floss.social to c/labplot@lemmy.kde.social
 
 
20


➡️ LabPlot - A free OriginPro alternative for Researchers (Multiple Peak Fit)

@labplot@lemmy.kde.social

Catalyst Nanomaterials Lab has published another video tutorial that will show you how to fit multiple peaks in your data using #LabPlot. Go check it out!

https://www.youtube.com/watch?v=Uf34So7DbZI

#FreeSoftware #DataAnalysis #DataViz #Research #OriginProAlternative #Science #Tutorial #FLOSS #FOSS #OpenSource #Business #BaselineCorrection #Peak #AlternativeTo #SciDavis

21


➡️ LabPlot - A free OriginPro alternative for Researchers (Baseline Correction)

@labplot@lemmy.kde.social

Catalyst Nanomaterials Lab has published another video tutorial that will show you how to Identify and remove unwanted baselines in your data using #LabPlot. Go check it out!

https://www.youtube.com/watch?v=nHczlEeZUZM

#FreeSoftware #DataAnalysis #DataViz #Research #OriginProAlternative #Science #Tutorial #FLOSS #FOSS #OpenSource #Business #BaselineCorrection #AlternativeTo

22


➡️ LabPlot - A free OriginPro alternative for Researchers (Tutorial 1 - Download and Installation)

@labplot@lemmy.kde.social

Catalyst Nanomaterials Lab has published a video tutorial that will guide you through downloading and installing LabPlot on your system. Go check it out!

https://www.youtube.com/watch?v=s6Codrauv0g

#LabPlot #FreeSoftware #DataAnalysis #DataViz #Research #OriginProAlternative #Science #Tutorial #FLOSS #FOSS #OpenSource #Business #AlternativeTo

23


The latest release of #LabPlot is here! 🚀 🙂

@labplot@lemmy.kde.social

LabPlot 2.11 comes with many new features and improvements in various areas.

Go get it!
➡️ https://labplot.kde.org/download/

Read more about the release here:
➡️ https://labplot.kde.org/2024/07/16/labplot-2-11-released/

#DataAnalysis #DataScience #Analytics #Data #DataAnalytics #DataViz #DataVisualization #Science #Statistics #Mathematics #FOSS #FLOSS #OpenSource #KDE #Education #Business #SciDAViS

24


Easy work with a #TriangularDistribution is now possible in #LabPlot [dev].

@labplot@lemmy.kde.social

Here are some of the most common applications of the triangular distribution:

▶️ Business and economic simulations
▶️ Risk analysis
▶️ Natural phenomena modeling
▶️ Decision-making
▶️ Manufacturing and quality control

#Business #Risk #DataAnalysis #Simulation #DataAnalysis #DataScience #Statistics #FOSS #OpenSource #Analytics #Projects #Math #Education

25
1
submitted 2 years ago* (last edited 2 years ago) by LabPlot@floss.social to c/labplot@lemmy.kde.social
view more: next ›